2020 College Basketball Preseason Rankings & Ratings For All 347 Teams
November 24, 2020 – by Jason Lisk
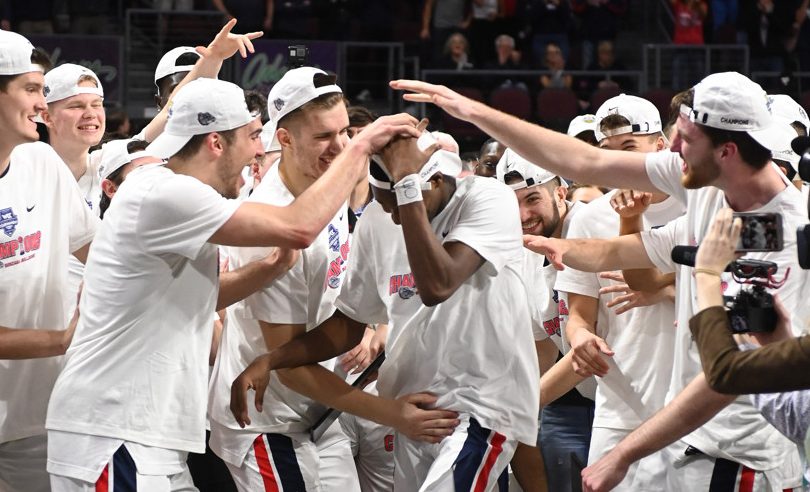
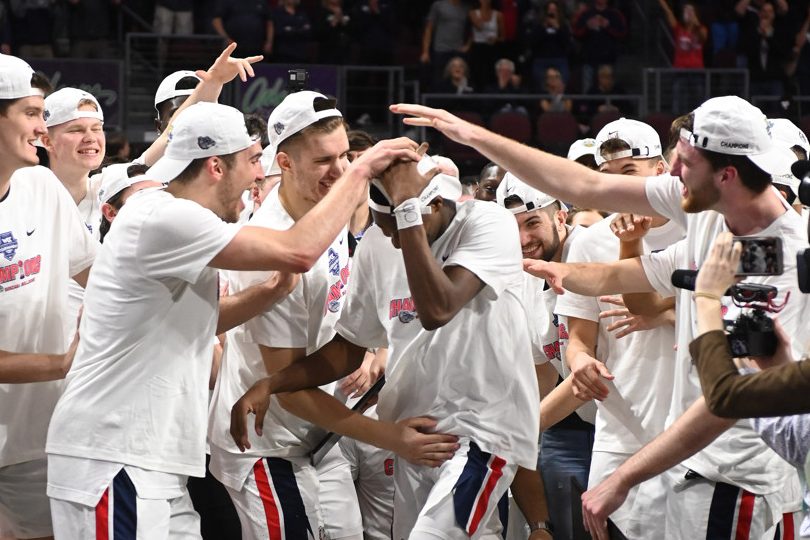
Gonzaga celebrates being named as the No. 1 team in our preseason ratings (Photo by Robert Johnson/Icon Sportswire)
The official TeamRankings 2020-21 college basketball preseason rankings have arrived.
If you want to read an in depth description of how these rankings are created, check out our blog post on how we make college basketball preseason ratings.
Otherwise, keep reading for a discussion of the preseason rankings highlights, full rankings and ratings for all 347 teams playing this year in Division I, and a breakdown of the underlying factors that contributed the most to each team’s rating.
Let’s start with what everybody asks first: “Who’s your number one?”
Gonzaga Is Our Preseason No. 1, But It’s Close
The Gonzaga Bulldogs start the 2020-21 college basketball season as our No. 1 rated team, just ahead of several others. Why Gonzaga? Here are four primary reasons:
Great last season. They were 3rd in our predictive power ratings at the end of last season, behind only Kansas and Duke.Consistently successful program. They have consistently ranked among the top college basketball programs in recent years, so they have a high Program rating (our component metric for how schools have performed in recent past seasons, which has proven to be predictive of future performance).Solid returning production. While they lost some key players to graduation, they have plenty of contributors coming back.Decent enough recruiting class. To that veteran core, they add a better recruiting class than some of last season’s other top contenders.
In the end, Gonzaga clocks in with a preseason predictive rating of 19.8. That means our ratings would expect the Zags to beat an average D1 college basketball team by nearly 20 points on a neutral court.
Note: We adjusted Gonzaga’s original 19.3 preseason rating up to 19.8 on Tuesday, November 24, to account for the just-announced eligibility of Florida transfer Andrew Nembhard.
Several Teams Nipping At Zags’ Heels
Take note, though: That same 19.8 rating is nearly two points less than the preseason top spot last year. In addition, four teams finished last season with a higher predictive rating than Gonzaga’s 2020 preseason rating.
So if you forced us to give you our No. 1 team this year, before the first college basketball game of the season tips off, we’d say Gonzaga — but the Zags are not far and away above other top contenders in 2020.
In fact, Gonzaga rates a very slight 0.6 points higher than our preseason No. 2, Villanova, and less than 1.5 points better than both No. 3 Baylor and No. 4 Kansas.
Veteran Teams Crowd The Top Of The Rankings
Among our top 10 teams in the college basketball preseason rankings, only three teams have an incoming recruiting class that also ranks in the top 10: Duke, Gonzaga, and Texas.
Often an elite recruiting class can catapult a team to an elite ranking, but that’s not the case this season. We project Kentucky with the most impactful incoming recruiting class in 2020, but it’s only the 32nd-best class overall in our database, which dates back to the 1998-99 season. In fact, the last time our top-ranked incoming freshman class was rated worse than Kentucky’s class this year was a whopping 15 years ago (in 2004).
Instead, 2020 looks to be a year where veteran-led teams lead the way.
Several teams, notably led by Baylor and Villanova, have plenty of returning production from last season, but are not expected to add many new faces to improve their 2020 outlook. Other teams, like West Virginia, Iowa, and Texas, also move into the Top 10 in our projections largely because of the strength of returning production.
Coronavirus Impact On The 2020 Rankings
The pandemic is likely to cause plenty of game cancellations during the 2020-21 college basketball season. But in this post, we are talking about team ratings, and not projections of end-of-season win totals or specific records.
These preseason ratings represent our estimate of how good teams will be, regardless of whether the COVID-19 situation results in them having some games canceled or losing opportunities to get key wins.
With that said, we have already seen with college football that positive coronavirus tests can impact who plays, and how teams perform from week-to-week. Lots of teams may play a portion of their schedule short-handed, or end up missing a star player for several games.
Still, trying to predict which teams will be most and least impacted by the pandemic this season is almost certainly a fool’s errand. So just be aware that we expect there to be more variance impacting where teams end up in terms of ratings at the end of the season, compared to non-pandemic years.
Our approach here is to establish a framework for predicting games as best we can using methods that have worked in the past, while acknowledging the unique challenges that the 2020-21 season will bring.
Preseason Top 25 Comparison
Moving on to the rest of our 2020 college basketball Top 25, let’s take a look at all the teams that made it into at least one preseason top 25 from among the following group of college basketball prognosticators:
Our 2019-20 college basketball preseason ratings (TR)Ken Pomeroy’s preseason ratings (KP)Bart Torvik’s preseason ratings(BT)AP poll (AP)Coaches poll (Coach)
The table below lists all such teams along with their preseason ranking in each system. It also shows the average rank, and concludes with a column indicating how far TR is from the consensus. (In that last column, a positive number means ranked a team better than the consensus rankings, while a negative number means we ranked a team worse than consensus.)
For teams receiving no votes in the polls, we used a rank of 55. Teams are listed in ascending order by average rank.
Note: We usually include ESPN’s Basketball Power Index preseason ratings (BPI) in this table as well, but the BPI rankings were not yet published when we wrote this post. Since that time, the BPI preseason ratings have been published. In addition, Ken Pomeroy and Bart Torvik have adjusted their ratings to account for recent player eligibility changes. We plan to update this section with final rankings from all sources once the season starts.
| Team | TR | KP | BT | AP | Coach | AVG | TR Diff |
|---|---|---|---|---|---|---|---|
| Gonzaga | 1 | 2 | 4 | 1 | 2 | 2.0 | 1.0 |
| Baylor | 3 | 1 | 5 | 2 | 1 | 2.4 | -0.6 |
| Villanova | 2 | 4 | 10 | 3 | 3 | 4.4 | 2.4 |
| Kansas | 4 | 5 | 12 | 6 | 5 | 6.4 | 2.4 |
| Duke | 5 | 3 | 8 | 9 | 8 | 6.6 | 1.6 |
| Virginia | 7 | 16 | 3 | 4 | 4 | 6.8 | -0.2 |
| Wisconsin | 12 | 7 | 9 | 7 | 7 | 8.4 | -3.6 |
| W Virginia | 6 | 8 | 2 | 15 | 15 | 9.2 | 3.2 |
| Texas Tech | 11 | 6 | 6 | 14 | 13 | 10.0 | -1.0 |
| Michigan St | 8 | 11 | 15 | 13 | 12 | 11.8 | 3.8 |
| Iowa | 9 | 13 | 27 | 5 | 6 | 12.0 | 3.0 |
| Texas | 10 | 9 | 1 | 19 | 22 | 12.2 | 2.2 |
| Creighton | 13 | 14 | 13 | 11 | 11 | 12.4 | -0.6 |
| Illinois | 14 | 17 | 17 | 8 | 10 | 13.2 | -0.8 |
| Kentucky | 15 | 12 | 22 | 10 | 9 | 13.6 | -1.4 |
| Tennessee | 19 | 19 | 19 | 12 | 14 | 16.6 | -2.4 |
| Florida St | 16 | 18 | 18 | 21 | 18 | 18.2 | 2.2 |
| Ohio State | 20 | 10 | 14 | 23 | 24 | 18.2 | -1.8 |
| Oregon | 18 | 20 | 16 | 20 | 20 | 18.8 | 0.8 |
| Michigan | 17 | 15 | 11 | 25 | 28 | 19.2 | 2.2 |
| N Carolina | 24 | 22 | 21 | 16 | 16 | 19.8 | -4.2 |
| Houston | 21 | 21 | 23 | 17 | 18 | 20.0 | -1.0 |
| Florida | 22 | 24 | 7 | 27 | 27 | 21.4 | -0.6 |
| Arizona St | 28 | 23 | 25 | 18 | 17 | 22.2 | -5.8 |
| UCLA | 25 | 29 | 34 | 22 | 21 | 26.2 | 1.2 |
| Rutgers | 31 | 27 | 32 | 24 | 23 | 27.4 | -3.6 |
| Indiana | 23 | 26 | 26 | 30 | 34 | 27.8 | 4.8 |
| Alabama | 45 | 46 | 37 | 29 | 25 | 36.4 | -8.6 |
| Syracuse | 43 | 31 | 24 | 55 | 42 | 39.0 | -4.0 |
| Purdue | 26 | 25 | 55 | 55 | 44 | 41.0 | 15.0 |
| Providence | 46 | 56 | 20 | 34 | 42 | 39.6 | -6.4 |
Preseason Top 25 Comparison Highlights
When comparing how teams are ranked across the various systems above, a few highlights stick out.
Teams The Human Polls Love (Relatively)
Even though rankings systems will always have their differences, there are some teams where the human polls are clearly more optimistic than the data-driven systems (i.e. TeamRankings, Pomeroy, Torvik).
Here are teams that are ranked at least three spots higher in both the preseason AP and Coaches Polls than in any of the data-driven rankings:
IowaIllinoisNorth CarolinaTennesseeHoustonArizona StateRutgersUCLAAlabama
Why are the pollsters are higher on those teams? That’s harder to divine. One general theme is that several of those teams had winning percentages that compared favorably to their underlying power rankings at the end of last season.
Team The Human Polls Dislike (Relatively)
Here are the teams that are ranked at least three spots lower in the preseason AP and Coaches Polls than in any of the data-driven rankings:
West VirginiaTexasOhio StateMichiganFloridaIndiana
The Big 12 and Big Ten were very tough conferences last season, and several of these teams rated higher in end-of-year data-driven power ratings than in the human polls.
These conferences also tend to have good program ratings as a group, and either good experience returning and/or good (but not great) recruiting classes. Four of the six teams above were in the Top 20 in our program rating (every one but Texas and Ohio State), and every recruiting class was in our Top 40, though Texas was the only Top 10 recruiting class.
Correlations With Consensus
For the 31 teams listed in the table above, our rankings have the highest correlation coefficient when comparing each ranking system with the consensus. Torvik’s rankings have the lowest overall correlation with consensus rankings.
The rank order of correlation to consensus is:
TeamRankings (0.937)Coaches Poll (0.918)AP Poll (0.911)Pomeroy (0.890)Torvik (0.770)
That’s the same order as last year, aside from Pomeroy sliding down below the human polls, but the correlation coefficients are all moderately higher. However, that’s a bit deceiving because we don’t have the ESPN BPI included in this year’s numbers, and that was one of the more outlier-filled systems a year ago. Removing BPI would therefore be expected to increase the correlations.
Still, the order being roughly the same is evidence it wasn’t some kind of fluke. Our rankings do seem to have fewer or smaller outliers than the other systems, and that makes sense, because we use market data to adjust for cases where our raw model seems to be missing something.
Our Rankings Are High On Purdue
Among the 31 teams listed in the table above, we only rank one team at least 9 spots better than consensus this year, and that’s Purdue.
We have the Boilermakers at No. 26, though we aren’t alone there, as Pomeroy has Purdue at No. 25. But the human polls and Torvik rank Purdue much further down.
Purdue had an off year last season in terms of wins and losses, losing lots of close/key games in a rugged Big Ten. But their power rating still ended up in the Top 30 and it is a program with a history of success in recent years.
Our Rankings Are Low On Three Teams
We rank three teams at least five spots worse than consensus (again, only looking at the teams listed in the table above). We’re most pessimistic about:
Alabama (TR:45, Average 36.4)Providence (TR: 46, Average 39.6)Arizona State (TR: 28, Average 22.2)
Last season we listed 11 teams that we were high or low on compared to the consensus. Based on their final rankings for the season, we beat the consensus on five, and the consensus beat us on the other six.
Full 2020-21 College Basketball Preseason Rankings, From #1 To #347
The table below shows our 2020-21 preseason ranking of 347 college basketball teams, along with each team’s associated preseason predictive rating.
The team ratings are expressed as points better (positive rating) or worse (negative rating) than a “perfectly average” college basketball team, when playing on a neutral court.
The final eight columns of the table show the relative contribution of specific factors our preseason ratings model considers, as well as a final “market adjustment” we make for each team.
Here’s a quick explanation of those factors. For more detail, read our post on how we make college basketball preseason ratings.
LAST YEAR: How good a team was last season (based on final predictive rating)PROGRAM: Recent historical performance, excluding last seasonRET OFF: Returning offensive production, compared to typicalRET DEF: Returning defensive production, compared to typicalRECRUIT: Value of incoming freshman recruiting classTRANSFER: Value of incoming Division I transfers (JUCO transfers ignored)COACH: Recent coaching changes expected to have positive or negative impactMARKET: Adjustment if our ratings-based projection for a team is far off the betting market or our rankings differ greatly from the AP poll
| TR Rank | Team | 20-21 Rating | LAST YR | PROGRAM | RET OFF | RET DEF | RECRUIT | TRANSFER | COACH | MARKET |
|---|---|---|---|---|---|---|---|---|---|---|
| 1 | Gonzaga | 19.8 | 8.7 | 5.2 | 1.0 | 1.6 | 2.8 | 0.5 | 0.0 | 0.0 |
| 2 | Villanova | 19.2 | 6.0 | 5.2 | 3.1 | 3.6 | 1.3 | 0.0 | 0.0 | 0.0 |
| 3 | Baylor | 18.6 | 7.4 | 3.9 | 3.6 | 3.0 | 0.6 | 0.0 | 0.0 | 0.0 |
| 4 | Kansas | 18.4 | 9.5 | 5.2 | 0.7 | 2.2 | 0.8 | 0.0 | 0.0 | 0.0 |
| 5 | Duke | 17.6 | 8.4 | 5.2 | -0.7 | 0.4 | 5.3 | 0.0 | 0.0 | -1.0 |
| 6 | W Virginia | 17.5 | 6.7 | 4.3 | 2.7 | 3.2 | 0.6 | 0.0 | 0.0 | 0.0 |
| 7 | Virginia | 17.1 | 3.8 | 5.2 | 0.6 | 2.7 | 1.2 | 3.6 | 0.0 | 0.0 |
| 8 | Michigan St | 16.9 | 8.2 | 5.1 | 1.2 | 2.2 | 1.2 | 0.0 | 0.0 | -1.0 |
| 9 | Iowa | 16.7 | 6.0 | 2.6 | 4.6 | 3.3 | 0.2 | 0.0 | 0.0 | 0.0 |
| 10 | Texas | 16.6 | 3.1 | 3.3 | 4.6 | 3.5 | 2.2 | 0.0 | 0.0 | 0.0 |
| 11 | Texas Tech | 16.4 | 5.9 | 4.7 | 0.2 | 0.7 | 1.7 | 3.3 | 0.0 | 0.0 |
| 12 | Wisconsin | 16.3 | 5.6 | 3.9 | 3.7 | 3.2 | 0.0 | 0.0 | 0.0 | 0.0 |
| 13 | Creighton | 16.0 | 6.0 | 3.8 | 3.2 | 2.8 | 0.3 | 0.0 | 0.0 | 0.0 |
| 14 | Illinois | 15.2 | 5.3 | 2.1 | 2.2 | 2.4 | 1.2 | 0.0 | 0.0 | 2.0 |
| 15 | Kentucky | 14.9 | 5.3 | 5.2 | -3.2 | -2.5 | 5.8 | 3.2 | 0.0 | 1.0 |
| 16 | Florida St | 14.7 | 6.2 | 4.4 | 0.2 | 0.8 | 2.1 | 0.0 | 0.0 | 1.0 |
| 17 | Michigan | 14.5 | 6.4 | 5.1 | 1.0 | 1.5 | 1.3 | 0.2 | 0.0 | -1.0 |
| 18 | Oregon | 14.5 | 6.4 | 3.8 | 0.0 | 0.8 | 0.7 | 2.9 | 0.0 | 0.0 |
| 19 | Tennessee | 14.2 | 3.4 | 4.3 | 1.8 | 1.9 | 2.2 | 0.6 | 0.0 | 0.0 |
| 20 | Ohio State | 13.9 | 7.0 | 3.4 | 1.0 | 1.2 | 0.6 | 0.7 | 0.0 | 0.0 |
| 21 | Houston | 13.9 | 5.9 | 4.0 | 2.0 | 1.7 | 0.3 | 0.0 | 0.0 | 0.0 |
| 22 | Florida | 13.9 | 5.0 | 4.6 | 1.7 | 2.1 | 1.5 | 0.0 | 0.0 | -1.0 |
| 23 | Indiana | 13.7 | 4.9 | 3.1 | 2.5 | 2.2 | 1.0 | 0.0 | 0.0 | 0.0 |
| 24 | N Carolina | 13.3 | 2.7 | 5.2 | 0.6 | 0.0 | 4.8 | 0.0 | 0.0 | 0.0 |
| 25 | UCLA | 12.8 | 2.8 | 3.2 | 3.8 | 2.5 | 0.5 | 0.0 | 0.0 | 0.0 |
| 26 | Purdue | 12.6 | 5.7 | 4.7 | 1.5 | 1.5 | 0.6 | 0.0 | 0.0 | -1.5 |
| 27 | Louisville | 12.5 | 6.4 | 4.5 | -1.4 | -0.4 | 0.4 | 3.1 | 0.0 | 0.0 |
| 28 | Arizona St | 12.5 | 3.5 | 2.2 | 1.7 | 0.6 | 1.8 | 0.7 | 0.0 | 2.0 |
| 29 | Oklahoma | 12.5 | 4.4 | 3.3 | 2.6 | 1.9 | 0.2 | 0.0 | 0.0 | 0.0 |
| 30 | Stanford | 12.1 | 4.2 | 1.5 | 2.0 | 2.6 | 1.8 | 0.0 | 0.0 | 0.0 |
| 31 | Rutgers | 11.7 | 5.6 | 1.3 | 2.8 | 2.5 | 0.4 | 0.0 | 0.0 | -1.0 |
| 32 | LSU | 11.6 | 4.9 | 2.2 | -0.4 | 0.4 | 1.3 | 0.1 | 0.0 | 3.0 |
| 33 | Oklahoma St | 11.0 | 3.8 | 3.2 | -1.4 | 0.3 | 5.2 | 0.0 | 0.0 | 0.0 |
| 34 | Arizona | 10.8 | 7.0 | 3.5 | -2.2 | -0.7 | 1.9 | 0.5 | 0.0 | 1.0 |
| 35 | VA Tech | 10.8 | 2.1 | 3.9 | 2.1 | 1.0 | 0.5 | 1.2 | 0.0 | 0.0 |
| 36 | Minnesota | 10.8 | 5.7 | 2.7 | 0.5 | 1.1 | 0.0 | 0.8 | 0.0 | 0.0 |
| 37 | Clemson | 10.7 | 3.0 | 3.6 | 2.2 | 1.5 | 0.4 | 0.0 | 0.0 | 0.0 |
| 38 | S Carolina | 10.7 | 3.0 | 2.9 | 1.9 | 1.9 | 0.0 | 0.0 | 0.0 | 1.0 |
| 39 | Miami (FL) | 10.6 | 1.5 | 3.1 | 1.5 | 0.9 | 1.2 | 2.5 | 0.0 | 0.0 |
| 40 | San Diego St | 10.6 | 6.7 | 2.1 | 0.5 | 1.3 | 0.0 | 0.0 | 0.0 | 0.0 |
| 41 | Marquette | 10.6 | 5.4 | 3.4 | -1.0 | 0.9 | 1.1 | 0.9 | 0.0 | 0.0 |
| 42 | NC State | 10.4 | 3.8 | 2.7 | 1.8 | 1.4 | 0.5 | 0.0 | 0.0 | 0.0 |
| 43 | Syracuse | 10.3 | 3.9 | 3.2 | 2.4 | 2.4 | 0.4 | 0.0 | 0.0 | -2.0 |
| 44 | Seton Hall | 10.3 | 6.0 | 3.1 | -0.1 | 1.4 | 0.0 | 0.0 | 0.0 | 0.0 |
| 45 | Alabama | 10.3 | 3.5 | 2.7 | 1.1 | 1.0 | 1.1 | 0.0 | 0.0 | 1.0 |
| 46 | Providence | 10.3 | 4.5 | 2.4 | 0.1 | 0.3 | 0.1 | 2.8 | 0.0 | 0.0 |
| 47 | GA Tech | 10.2 | 3.1 | 1.5 | 2.7 | 1.9 | 0.0 | 0.0 | 0.0 | 1.0 |
| 48 | Colorado | 10.1 | 5.0 | 2.0 | 1.8 | 1.3 | 0.0 | 0.0 | 0.0 | 0.0 |
| 49 | Maryland | 10.1 | 6.3 | 3.5 | -0.7 | 0.7 | 0.2 | 0.0 | 0.0 | 0.0 |
| 50 | Dayton | 10.0 | 7.0 | 2.0 | 0.3 | 0.7 | 0.0 | 0.0 | 0.0 | 0.0 |
| 51 | Connecticut | 10.0 | 3.4 | 1.1 | 1.6 | 1.5 | 1.1 | 1.2 | 0.0 | 0.0 |
| 52 | Memphis | 9.8 | 3.9 | 1.4 | 0.6 | 1.3 | 2.5 | 0.0 | 0.0 | 0.0 |
| 53 | Arkansas | 9.8 | 4.4 | 3.3 | -2.4 | -1.3 | 1.1 | 3.6 | 0.0 | 1.0 |
| 54 | Butler | 9.7 | 5.4 | 3.6 | -0.2 | 0.6 | 0.3 | 0.0 | 0.0 | 0.0 |
| 55 | Richmond | 9.5 | 3.7 | 0.2 | 3.0 | 2.6 | 0.0 | 0.0 | 0.0 | 0.0 |
| 56 | Loyola-Chi | 9.5 | 1.4 | 1.7 | 3.8 | 2.5 | 0.0 | 0.0 | 0.0 | 0.0 |
| 57 | Xavier | 9.4 | 4.0 | 3.6 | -0.1 | 0.4 | 0.5 | 1.1 | 0.0 | 0.0 |
| 58 | Utah | 9.3 | 2.3 | 2.4 | 3.7 | 2.5 | 0.5 | 0.0 | 0.0 | -2.0 |
| 59 | BYU | 9.3 | 6.3 | 1.9 | -0.9 | 0.0 | 0.0 | 2.0 | 0.0 | 0.0 |
| 60 | Missouri | 9.2 | 2.3 | 1.9 | 3.3 | 2.5 | 0.2 | 0.0 | 0.0 | -1.0 |
| 61 | USC | 9.2 | 3.5 | 2.6 | -3.1 | -1.4 | 3.0 | 2.6 | 0.0 | 2.0 |
| 62 | Cincinnati | 9.2 | 4.0 | 4.5 | 0.6 | 0.6 | 0.4 | 0.0 | 0.0 | -1.0 |
| 63 | Saint Louis | 9.2 | 2.6 | -0.1 | 3.8 | 2.8 | 0.0 | 0.0 | 0.0 | 0.0 |
| 64 | S Methodist | 9.1 | 2.2 | 2.8 | 2.4 | 1.8 | 0.0 | 0.0 | 0.0 | 0.0 |
| 65 | Washington | 9.0 | 3.9 | 1.6 | 0.6 | 1.2 | 1.8 | 0.0 | 0.0 | 0.0 |
| 66 | Notre Dame | 8.9 | 3.4 | 3.2 | 0.6 | 0.7 | 0.0 | 0.0 | 0.0 | 1.0 |
| 67 | Mississippi | 8.8 | 1.7 | 2.3 | 0.9 | 1.1 | 0.5 | 3.4 | 0.0 | -1.0 |
| 68 | Furman | 8.7 | 2.5 | 1.8 | 2.5 | 1.9 | 0.0 | 0.0 | 0.0 | 0.0 |
| 69 | Utah State | 8.2 | 4.5 | 1.5 | 0.7 | 1.5 | 0.0 | 0.0 | 0.0 | 0.0 |
| 70 | St Johns | 8.2 | 3.1 | 1.9 | 1.8 | 1.3 | 0.0 | 0.1 | 0.0 | 0.0 |
| 71 | Penn State | 8.1 | 5.6 | 2.9 | 1.8 | 1.8 | 0.0 | 0.0 | -4.0 | 0.0 |
| 72 | N Iowa | 8.0 | 3.3 | 0.4 | 2.8 | 1.5 | 0.0 | 0.0 | 0.0 | 0.0 |
| 73 | DePaul | 7.9 | 1.9 | 1.0 | 0.7 | 1.0 | 0.2 | 3.2 | 0.0 | 0.0 |
| 74 | TX Christian | 7.7 | 2.6 | 3.7 | 0.0 | 1.1 | 0.1 | 0.1 | 0.0 | 0.0 |
| 75 | Texas A&M | 7.7 | 0.5 | 2.6 | -0.1 | 0.8 | 0.7 | 3.2 | 0.0 | 0.0 |
| 76 | Iowa State | 7.3 | 2.4 | 3.8 | 0.4 | 0.2 | 0.3 | 0.2 | 0.0 | 0.0 |
| 77 | Davidson | 7.3 | 2.8 | 2.1 | 1.8 | 1.6 | 0.0 | 0.0 | 0.0 | -1.0 |
| 78 | Rhode Island | 7.2 | 2.9 | 2.3 | 0.0 | -0.4 | 0.0 | 2.4 | 0.0 | 0.0 |
| 79 | St Bonavent | 7.2 | 0.4 | 1.6 | 1.9 | 0.9 | 0.0 | 2.4 | 0.0 | 0.0 |
| 80 | NC-Grnsboro | 7.0 | 2.1 | 1.3 | 1.9 | 1.1 | 0.0 | 0.6 | 0.0 | 0.0 |
| 81 | Northwestern | 6.9 | 0.9 | 2.7 | 1.9 | 1.1 | 0.1 | 0.2 | 0.0 | 0.0 |
| 82 | W Kentucky | 6.9 | 1.0 | 0.9 | 2.0 | 1.0 | 0.0 | 2.1 | 0.0 | 0.0 |
| 83 | Miss State | 6.9 | 3.9 | 2.8 | -1.4 | -0.2 | 0.4 | 1.3 | 0.0 | 0.0 |
| 84 | Boise State | 6.7 | 2.7 | 1.8 | -0.7 | -0.3 | 0.0 | 1.3 | 0.0 | 2.0 |
| 85 | Duquesne | 6.7 | 1.7 | -0.5 | 3.3 | 2.2 | 0.0 | 0.0 | 0.0 | 0.0 |
| 86 | Vermont | 6.5 | 2.3 | 1.9 | 0.9 | 1.1 | 0.0 | 0.3 | 0.0 | 0.0 |
| 87 | St Marys | 6.4 | 3.9 | 3.6 | -1.3 | 0.2 | 0.0 | 0.0 | 0.0 | 0.0 |
| 88 | Wichita St | 6.3 | 4.5 | 3.9 | 0.5 | 0.4 | 0.0 | 0.0 | -3.0 | 0.0 |
| 89 | Auburn | 6.3 | 5.0 | 3.8 | -3.2 | -1.5 | 1.3 | 0.0 | 0.0 | 1.0 |
| 90 | Pittsburgh | 6.3 | 1.5 | 1.1 | 1.7 | 0.9 | 0.3 | 0.8 | 0.0 | 0.0 |
| 91 | Georgetown | 6.2 | 3.0 | 1.9 | -1.0 | -0.1 | 0.0 | 2.4 | 0.0 | 0.0 |
| 92 | S Dakota St | 6.2 | 0.1 | 1.3 | 2.9 | 1.8 | 0.0 | 0.0 | 0.0 | 0.0 |
| 93 | Georgia | 6.1 | 1.9 | 2.1 | -2.0 | -1.2 | 1.3 | 3.9 | 0.0 | 0.0 |
| 94 | Marshall | 5.8 | -0.1 | 0.5 | 3.4 | 2.0 | 0.0 | 0.0 | 0.0 | 0.0 |
| 95 | San Fransco | 5.3 | 2.6 | 1.2 | 0.1 | 0.7 | 0.0 | 0.8 | 0.0 | 0.0 |
| 96 | S Florida | 5.3 | 0.7 | -0.9 | 1.1 | 0.7 | 0.3 | 0.3 | 0.0 | 3.0 |
| 97 | VCU | 5.3 | 2.9 | 2.2 | -0.9 | -0.2 | 0.1 | 1.1 | 0.0 | 0.0 |
| 98 | Georgia St | 5.2 | 0.7 | 0.9 | 2.2 | 1.1 | 0.0 | 0.4 | 0.0 | 0.0 |
| 99 | California | 5.1 | -0.3 | 0.0 | 1.6 | 0.8 | 0.0 | 2.9 | 0.0 | 0.0 |
| 100 | LA Tech | 4.8 | 2.4 | 0.9 | 0.7 | 0.7 | 0.0 | 0.0 | 0.0 | 0.0 |
| 101 | Wake Forest | 4.5 | 1.5 | 1.8 | -2.1 | -0.5 | 0.0 | 1.7 | 2.0 | 0.0 |
| 102 | Old Dominion | 4.5 | -0.9 | 1.5 | 2.5 | 0.9 | 0.0 | 0.5 | 0.0 | 0.0 |
| 103 | Murray St | 4.5 | 0.3 | 1.5 | 1.7 | 0.9 | 0.0 | 0.0 | 0.0 | 0.0 |
| 104 | Central FL | 4.5 | 0.9 | 2.3 | -0.7 | -0.2 | 0.0 | 2.2 | 0.0 | 0.0 |
| 105 | Belmont | 4.4 | 1.6 | 2.1 | 0.4 | 0.4 | 0.0 | 0.0 | 0.0 | 0.0 |
| 106 | Colorado St | 4.4 | 1.5 | 0.1 | 2.1 | 0.7 | 0.0 | 0.0 | 0.0 | 0.0 |
| 107 | Kansas St | 4.4 | 2.3 | 3.6 | -1.1 | -0.4 | 0.0 | 0.0 | 0.0 | 0.0 |
| 108 | Buffalo | 4.3 | -0.2 | 2.4 | 1.5 | 0.6 | 0.0 | 0.0 | 0.0 | 0.0 |
| 109 | Winthrop | 4.3 | 0.0 | 0.2 | 2.5 | 1.7 | 0.0 | 0.0 | 0.0 | 0.0 |
| 110 | Oregon St | 4.3 | 2.7 | 0.7 | 0.1 | 0.7 | 0.0 | 0.1 | 0.0 | 0.0 |
| 111 | Boston Col | 4.2 | -0.8 | 1.2 | 0.3 | -0.1 | 0.0 | 3.6 | 0.0 | 0.0 |
| 112 | N Mex State | 4.2 | 1.3 | 2.2 | 0.1 | -0.3 | 0.0 | 1.0 | 0.0 | 0.0 |
| 113 | North Texas | 4.1 | 2.3 | -0.6 | 1.5 | 1.0 | 0.0 | 0.0 | 0.0 | 0.0 |
| 114 | Tulsa | 4.1 | 2.2 | 0.9 | -0.1 | 0.3 | 0.0 | 0.8 | 0.0 | 0.0 |
| 115 | Indiana St | 3.9 | 0.4 | -0.1 | 1.1 | 0.6 | 0.0 | 2.0 | 0.0 | 0.0 |
| 116 | Nevada | 3.5 | 2.5 | 3.6 | -2.3 | -0.5 | 0.0 | 2.3 | 0.0 | -2.0 |
| 117 | Geo Mason | 3.5 | -0.9 | 0.0 | 2.9 | 1.5 | 0.0 | 0.0 | 0.0 | 0.0 |
| 118 | UAB | 3.3 | -1.3 | 0.5 | 0.7 | -0.2 | 0.0 | 3.6 | 0.0 | 0.0 |
| 119 | UNLV | 3.3 | 1.5 | 0.3 | -0.3 | 0.0 | 0.0 | 1.9 | 0.0 | 0.0 |
| 120 | Vanderbilt | 3.2 | -0.3 | 2.0 | -0.4 | 0.6 | 0.0 | 1.2 | 0.0 | 0.0 |
| 121 | E Washingtn | 3.0 | 0.6 | -0.4 | 1.3 | 1.5 | 0.0 | 0.0 | 0.0 | 0.0 |
| 122 | Bradley | 2.7 | 1.4 | 0.0 | -0.1 | 0.5 | 0.0 | 0.9 | 0.0 | 0.0 |
| 123 | Ball State | 2.7 | 1.0 | 0.2 | 0.6 | 0.6 | 0.0 | 0.2 | 0.0 | 0.0 |
| 124 | Wright State | 2.6 | 0.2 | 0.6 | 0.5 | 0.7 | 0.0 | 0.6 | 0.0 | 0.0 |
| 125 | Akron | 2.6 | 2.4 | 0.4 | -0.1 | -0.3 | 0.0 | 0.2 | 0.0 | 0.0 |
| 126 | UCSB | 2.4 | -0.8 | -0.8 | 1.2 | 1.1 | 0.0 | 1.7 | 0.0 | 0.0 |
| 127 | Ste F Austin | 2.2 | 1.4 | -0.8 | 0.4 | 0.6 | 0.0 | 0.6 | 0.0 | 0.0 |
| 128 | Pepperdine | 2.1 | 0.0 | -1.4 | 1.5 | 0.9 | 0.0 | 0.0 | 0.0 | 1.0 |
| 129 | Colgate | 2.0 | 0.2 | -0.5 | 1.3 | 0.7 | 0.0 | 0.2 | 0.0 | 0.0 |
| 130 | AR Lit Rock | 1.9 | 0.3 | -1.4 | 1.7 | 1.2 | 0.0 | 0.0 | 0.0 | 0.0 |
| 131 | UC Irvine | 1.9 | 1.0 | 0.9 | -0.3 | 0.2 | 0.0 | 0.0 | 0.0 | 0.0 |
| 132 | Texas State | 1.8 | 1.6 | -0.1 | 0.9 | 1.3 | 0.0 | 0.0 | -2.0 | 0.0 |
| 133 | U Mass | 1.7 | -0.8 | -0.4 | 1.4 | 0.0 | 0.1 | 1.2 | 0.0 | 0.0 |
| 134 | Wofford | 1.7 | -0.1 | 1.5 | -0.1 | 0.0 | 0.0 | 0.3 | 0.0 | 0.0 |
| 135 | Ohio | 1.5 | -0.5 | 0.1 | 1.5 | 0.5 | 0.0 | 0.0 | 0.0 | 0.0 |
| 136 | Toledo | 1.2 | -0.1 | 1.3 | 0.3 | -0.3 | 0.0 | 0.0 | 0.0 | 0.0 |
| 137 | Loyola Mymt | 1.2 | -1.9 | -0.2 | 1.1 | -0.3 | 0.0 | 2.4 | 0.0 | 0.0 |
| 138 | Santa Clara | 1.1 | -0.7 | -0.7 | 1.5 | 0.9 | 0.0 | 0.1 | 0.0 | 0.0 |
| 139 | Nebraska | 0.9 | -0.5 | 2.6 | -2.1 | -1.1 | 0.0 | 2.1 | 0.0 | 0.0 |
| 140 | TX-Arlington | 0.8 | 0.3 | 1.1 | -0.4 | -0.2 | 0.0 | 0.0 | 0.0 | 0.0 |
| 141 | Temple | 0.8 | 1.5 | 1.7 | -1.7 | -0.9 | 0.0 | 0.2 | 0.0 | 0.0 |
| 142 | Austin Peay | 0.6 | -0.8 | -0.7 | 1.6 | 0.2 | 0.0 | 0.4 | 0.0 | 0.0 |
| 143 | Liberty | 0.5 | 1.4 | 0.1 | -1.2 | 0.2 | 0.0 | 0.0 | 0.0 | 0.0 |
| 144 | Wyoming | 0.5 | -2.8 | -0.3 | 0.3 | -0.6 | 0.0 | 0.0 | 4.0 | 0.0 |
| 145 | Bowling Grn | 0.5 | -0.7 | -0.5 | 1.3 | 0.3 | 0.0 | 0.0 | 0.0 | 0.0 |
| 146 | Valparaiso | 0.4 | -0.4 | 0.3 | 0.0 | 0.5 | 0.0 | 0.0 | 0.0 | 0.0 |
| 147 | Col Charlestn | 0.4 | -0.7 | 1.1 | -1.0 | -0.2 | 0.0 | 1.3 | 0.0 | 0.0 |
| 148 | E Carolina | 0.3 | -2.2 | -1.5 | 2.6 | 1.3 | 0.0 | 0.2 | 0.0 | 0.0 |
| 149 | Pacific | 0.3 | 0.3 | -0.6 | -0.6 | 0.2 | 0.0 | 0.9 | 0.0 | 0.0 |
| 150 | Grd Canyon | 0.2 | -3.7 | 0.9 | -0.2 | -0.7 | 0.0 | 1.9 | 2.0 | 0.0 |
| 151 | Boston U | 0.1 | -1.1 | -0.9 | 1.0 | 1.1 | 0.0 | 0.0 | 0.0 | 0.0 |
| 152 | Florida Intl | 0.1 | -0.2 | -1.3 | -0.6 | -0.2 | 0.0 | 2.4 | 0.0 | 0.0 |
| 153 | Drake | -0.1 | -0.8 | -0.1 | 0.6 | 0.2 | 0.0 | 0.0 | 0.0 | 0.0 |
| 154 | TX-San Ant | -0.2 | -2.3 | -0.4 | 2.1 | 0.2 | 0.0 | 0.3 | 0.0 | 0.0 |
| 155 | Montana | -0.2 | -0.4 | 0.9 | -1.8 | -0.4 | 0.0 | 1.6 | 0.0 | 0.0 |
| 156 | New Mexico | -0.2 | 0.2 | 0.7 | -1.9 | -1.3 | 0.0 | 0.1 | 0.0 | 2.0 |
| 157 | Chattanooga | -0.3 | -0.2 | -1.1 | -1.1 | -0.4 | 0.0 | 2.5 | 0.0 | 0.0 |
| 158 | Wash State | -0.4 | 0.8 | -0.4 | -0.8 | 0.0 | 0.0 | 0.0 | 0.0 | 0.0 |
| 159 | Siena | -0.4 | -0.8 | -1.3 | 0.5 | 0.2 | 0.0 | 0.9 | 0.0 | 0.0 |
| 160 | Missouri St | -0.6 | 0.5 | 0.5 | -0.8 | -0.9 | 0.0 | 0.0 | 0.0 | 0.0 |
| 161 | E Michigan | -0.7 | -2.1 | 0.3 | 0.8 | 0.2 | 0.0 | 0.0 | 0.0 | 0.0 |
| 162 | Fresno St | -0.7 | -0.3 | 1.9 | -1.7 | -0.8 | 0.0 | 0.2 | 0.0 | 0.0 |
| 163 | N Kentucky | -0.7 | -0.5 | 1.2 | -1.1 | -0.3 | 0.0 | 0.0 | 0.0 | 0.0 |
| 164 | Abl Christian | -0.8 | -1.5 | -1.5 | 1.5 | 0.6 | 0.0 | 0.0 | 0.0 | 0.0 |
| 165 | E Illinois | -0.8 | -2.3 | -1.7 | 2.1 | 0.4 | 0.0 | 0.5 | 0.0 | 0.0 |
| 166 | TX El Paso | -0.8 | -1.4 | -1.3 | 1.2 | -0.1 | 0.0 | 0.8 | 0.0 | 0.0 |
| 167 | S Illinois | -0.9 | -1.0 | 0.4 | -0.7 | -0.6 | 0.0 | 1.1 | 0.0 | 0.0 |
| 168 | Coastal Car | -1.0 | -1.3 | -0.4 | 0.3 | 0.0 | 0.0 | 0.4 | 0.0 | 0.0 |
| 169 | E Tenn St | -1.0 | 3.3 | 1.9 | -3.3 | -2.4 | 0.0 | 2.5 | -3.0 | 0.0 |
| 170 | Towson | -1.0 | -1.3 | -0.2 | -1.2 | -0.5 | 0.0 | 2.1 | 0.0 | 0.0 |
| 171 | Miami (OH) | -1.1 | -2.2 | -0.7 | 1.0 | 0.5 | 0.0 | 0.3 | 0.0 | 0.0 |
| 172 | Northeastrn | -1.1 | -0.2 | 1.1 | -1.6 | -0.5 | 0.0 | 0.1 | 0.0 | 0.0 |
| 173 | Middle Tenn | -1.1 | -4.3 | 1.4 | -1.6 | -0.7 | 0.0 | 4.1 | 0.0 | 0.0 |
| 174 | S Alabama | -1.2 | -1.1 | -1.0 | -2.7 | -1.5 | 0.0 | 5.0 | 0.0 | 0.0 |
| 175 | San Diego | -1.2 | -2.8 | 0.3 | -0.2 | -0.4 | 0.0 | 1.8 | 0.0 | 0.0 |
| 176 | N Dakota St | -1.4 | 0.4 | -0.1 | -1.4 | -0.2 | 0.0 | 0.0 | 0.0 | 0.0 |
| 177 | La Salle | -1.4 | -1.3 | -0.1 | 0.3 | 0.4 | 0.0 | 0.2 | 0.0 | -1.0 |
| 178 | Hofstra | -1.5 | 0.6 | 0.6 | -0.3 | 0.6 | 0.0 | 0.0 | -3.0 | 0.0 |
| 179 | Kent State | -1.5 | 0.7 | 0.1 | -1.6 | -0.9 | 0.0 | 0.2 | 0.0 | 0.0 |
| 180 | Monmouth | -1.6 | -2.3 | -0.2 | 0.7 | 0.0 | 0.0 | 0.3 | 0.0 | 0.0 |
| 181 | Lipscomb | -1.6 | -3.4 | 1.1 | 0.7 | -0.1 | 0.0 | 0.0 | 0.0 | 0.0 |
| 182 | Drexel | -1.6 | -3.1 | -1.5 | 2.2 | 0.8 | 0.0 | 0.0 | 0.0 | 0.0 |
| 183 | Oral Roberts | -1.6 | 0.5 | -1.5 | -0.2 | -0.4 | 0.0 | 0.0 | 0.0 | 0.0 |
| 184 | W Carolina | -1.7 | -0.3 | -2.7 | 0.6 | 0.7 | 0.0 | 0.0 | 0.0 | 0.0 |
| 185 | Mercer | -1.9 | -2.1 | 0.0 | -0.9 | -0.3 | 0.0 | 1.4 | 0.0 | 0.0 |
| 186 | St Peters | -1.9 | -2.0 | -0.9 | 0.2 | 0.1 | 0.0 | 0.6 | 0.0 | 0.0 |
| 187 | N Colorado | -2.1 | 1.8 | -0.3 | -1.2 | 0.0 | 0.0 | 0.6 | -3.0 | 0.0 |
| 188 | St Josephs | -2.1 | -3.6 | 0.3 | 1.5 | -0.3 | 0.0 | 0.0 | 0.0 | 0.0 |
| 189 | N Illinois | -2.3 | -1.2 | -0.4 | -0.6 | -0.3 | 0.0 | 0.2 | 0.0 | 0.0 |
| 190 | LA Lafayette | -2.3 | -2.8 | 1.0 | -0.3 | -0.2 | 0.0 | 0.0 | 0.0 | 0.0 |
| 191 | Charlotte | -2.4 | -0.6 | -2.0 | 0.3 | -0.4 | 0.0 | 0.3 | 0.0 | 0.0 |
| 192 | S Utah | -2.4 | -0.3 | -2.3 | 0.1 | -0.1 | 0.0 | 0.2 | 0.0 | 0.0 |
| 193 | App State | -2.4 | -1.1 | -0.8 | -0.4 | -0.2 | 0.0 | 0.1 | 0.0 | 0.0 |
| 194 | Geo Wshgtn | -2.4 | -2.9 | -0.6 | -0.3 | 0.0 | 0.0 | 1.4 | 0.0 | 0.0 |
| 195 | CS Bakersfld | -2.5 | -3.7 | -0.3 | 1.1 | 0.1 | 0.0 | 0.3 | 0.0 | 0.0 |
| 196 | Hawaii | -2.5 | -1.7 | -0.9 | -1.0 | -0.8 | 0.0 | 1.9 | 0.0 | 0.0 |
| 197 | Illinois St | -2.6 | -2.3 | 0.8 | -0.8 | -0.5 | 0.0 | 0.2 | 0.0 | 0.0 |
| 198 | Canisius | -2.6 | -3.6 | -0.5 | 0.7 | -0.3 | 0.0 | 1.1 | 0.0 | 0.0 |
| 199 | Fla Atlantic | -2.6 | -1.6 | -1.0 | 0.1 | -0.2 | 0.0 | 0.0 | 0.0 | 0.0 |
| 200 | South Dakota | -2.6 | -1.1 | 0.4 | -1.7 | -0.7 | 0.0 | 0.4 | 0.0 | 0.0 |
| 201 | Maryland BC | -2.8 | -3.8 | -0.7 | 1.0 | -0.2 | 0.0 | 0.7 | 0.0 | 0.0 |
| 202 | Neb Omaha | -2.8 | -2.8 | -0.8 | 0.2 | 0.5 | 0.0 | 0.0 | 0.0 | 0.0 |
| 203 | IPFW | -2.8 | -4.0 | 0.2 | -0.1 | -0.5 | 0.0 | 1.6 | 0.0 | 0.0 |
| 204 | UC Riverside | -3.0 | -2.3 | -2.3 | 0.8 | 0.3 | 0.0 | 0.5 | 0.0 | 0.0 |
| 205 | Fla Gulf Cst | -3.0 | -4.9 | 0.4 | 0.9 | -0.7 | 0.0 | 1.3 | 0.0 | 0.0 |
| 206 | NC-Asheville | -3.1 | -4.7 | -1.5 | 1.8 | 0.2 | 0.0 | 1.1 | 0.0 | 0.0 |
| 207 | Navy | -3.1 | -3.6 | -1.3 | 1.3 | 0.4 | 0.0 | 0.0 | 0.0 | 0.0 |
| 208 | James Mad | -3.1 | -4.8 | -1.3 | -0.4 | -1.0 | 0.0 | 2.4 | 2.0 | 0.0 |
| 209 | N Hampshire | -3.3 | -3.4 | -2.2 | 1.6 | 0.6 | 0.0 | 0.0 | 0.0 | 0.0 |
| 210 | N Florida | -3.4 | -0.7 | -1.5 | -1.2 | -0.7 | 0.0 | 0.7 | 0.0 | 0.0 |
| 211 | UC Davis | -3.4 | -2.6 | -0.5 | -0.4 | 0.0 | 0.0 | 0.1 | 0.0 | 0.0 |
| 212 | Nicholls St | -3.5 | -1.5 | -1.8 | -1.0 | -0.9 | 0.0 | 1.7 | 0.0 | 0.0 |
| 213 | Iona | -3.7 | -3.1 | 0.2 | -1.8 | -1.3 | 0.0 | 0.2 | 2.0 | 0.0 |
| 214 | UC San Diego | -4.5 | -1.5 | -3.3 | -0.4 | -0.2 | 0.0 | 0.8 | 0.0 | 0.0 |
| 215 | Stony Brook | -3.7 | -1.4 | -0.6 | -2.6 | -1.0 | 0.0 | 1.9 | 0.0 | 0.0 |
| 216 | IL-Chicago | -3.7 | -2.5 | -0.7 | -0.6 | -0.5 | 0.0 | 0.6 | 0.0 | 0.0 |
| 217 | Bucknell | -3.7 | -3.6 | 1.4 | -1.0 | -0.6 | 0.0 | 0.0 | 0.0 | 0.0 |
| 218 | Montana St | -3.8 | -2.7 | -1.6 | -0.5 | -0.4 | 0.0 | 1.4 | 0.0 | 0.0 |
| 219 | Portland St | -4.0 | -1.3 | -0.9 | -2.6 | -1.8 | 0.0 | 2.6 | 0.0 | 0.0 |
| 220 | Air Force | -4.0 | -1.5 | -1.1 | -1.1 | -0.7 | 0.0 | 0.4 | 0.0 | 0.0 |
| 221 | Youngs St | -4.1 | -3.0 | -2.3 | 1.1 | 0.1 | 0.0 | 0.0 | 0.0 | 0.0 |
| 222 | Wm & Mary | -4.1 | -1.8 | 0.0 | -1.2 | -1.1 | 0.0 | 0.0 | 0.0 | 0.0 |
| 223 | Arkansas St | -4.1 | -2.1 | -0.9 | -0.3 | -0.8 | 0.0 | 0.0 | 0.0 | 0.0 |
| 224 | Norfolk St | -4.2 | -3.3 | -2.2 | 0.0 | -0.2 | 0.0 | 1.5 | 0.0 | 0.0 |
| 225 | Tulane | -4.2 | -0.9 | -1.0 | -2.5 | -1.1 | 0.0 | 1.3 | 0.0 | 0.0 |
| 226 | NJIT | -4.3 | -4.6 | -1.3 | 1.1 | -0.4 | 0.0 | 0.9 | 0.0 | 0.0 |
| 227 | Delaware | -4.3 | -1.4 | -1.7 | -0.8 | -0.4 | 0.0 | 0.0 | 0.0 | 0.0 |
| 228 | Elon | -4.3 | -4.5 | -1.1 | 0.2 | -0.2 | 0.0 | 1.3 | 0.0 | 0.0 |
| 229 | St Fran (PA) | -4.3 | -1.1 | -1.5 | -1.3 | -0.4 | 0.0 | 0.0 | 0.0 | 0.0 |
| 230 | WI-Grn Bay | -4.3 | -2.7 | -0.8 | -1.5 | -1.5 | 0.0 | 1.1 | 1.0 | 0.0 |
| 231 | NC-Wilmgton | -4.4 | -4.7 | -0.2 | 0.7 | -0.1 | 0.0 | 0.0 | 0.0 | 0.0 |
| 232 | Rob Morris | -4.4 | -2.3 | -1.6 | -0.3 | -0.3 | 0.0 | 0.0 | 0.0 | 0.0 |
| 233 | Lamar | -4.5 | -3.3 | -0.7 | -0.3 | -0.2 | 0.0 | 0.0 | 0.0 | 0.0 |
| 234 | W Michigan | -4.5 | -2.9 | -0.7 | -1.4 | -0.1 | 0.0 | 0.7 | 0.0 | 0.0 |
| 235 | Utah Val St | -4.5 | -3.4 | 1.0 | -2.7 | -1.6 | 0.0 | 2.2 | 0.0 | 0.0 |
| 236 | Oakland | -4.5 | -3.3 | 0.3 | -1.2 | -1.0 | 0.0 | 0.6 | 0.0 | 0.0 |
| 237 | Central Mich | -4.6 | -1.6 | 0.0 | -2.0 | -1.0 | 0.0 | 0.0 | 0.0 | 0.0 |
| 238 | GA Southern | -4.7 | -0.3 | 0.6 | -2.4 | -1.5 | 0.0 | 0.9 | -2.0 | 0.0 |
| 239 | E Kentucky | -4.7 | -4.4 | -1.8 | 0.5 | -0.4 | 0.0 | 1.4 | 0.0 | 0.0 |
| 240 | TX-Pan Am | -4.9 | -3.8 | -1.5 | -0.8 | -0.3 | 0.0 | 1.5 | 0.0 | 0.0 |
| 241 | TX Southern | -4.9 | -4.5 | -0.9 | 0.4 | -0.3 | 0.0 | 0.3 | 0.0 | 0.0 |
| 242 | Mass Lowell | -5.0 | -3.7 | -1.9 | -0.4 | -0.4 | 0.0 | 1.5 | 0.0 | 0.0 |
| 243 | Lafayette | -5.0 | -2.8 | -2.6 | 0.5 | -0.1 | 0.0 | 0.1 | 0.0 | 0.0 |
| 244 | Sac State | -5.0 | -1.4 | -2.1 | -1.2 | -0.7 | 0.0 | 0.4 | 0.0 | 0.0 |
| 245 | F Dickinson | -5.1 | -4.3 | -1.7 | 1.1 | -0.1 | 0.0 | 0.0 | 0.0 | 0.0 |
| 246 | Fordham | -5.1 | -2.9 | -1.3 | -1.0 | 0.2 | 0.0 | 0.0 | 0.0 | 0.0 |
| 247 | American | -5.1 | -2.2 | -2.1 | -0.6 | -0.2 | 0.0 | 0.0 | 0.0 | 0.0 |
| 248 | Rice | -5.1 | -2.0 | -1.0 | -2.5 | -1.1 | 0.0 | 1.5 | 0.0 | 0.0 |
| 249 | Campbell | -5.2 | -3.7 | -1.2 | 0.2 | -0.6 | 0.0 | 0.0 | 0.0 | 0.0 |
| 250 | Lg Beach St | -5.2 | -4.5 | -0.9 | 0.4 | -0.2 | 0.0 | 0.0 | 0.0 | 0.0 |
| 251 | Gard-Webb | -5.2 | -2.7 | -0.7 | -1.0 | -0.8 | 0.0 | 0.0 | 0.0 | 0.0 |
| 252 | Hartford | -5.2 | -3.3 | -1.8 | -0.3 | -0.4 | 0.0 | 0.4 | 0.0 | 0.0 |
| 253 | Weber State | -5.3 | -4.0 | 0.0 | -2.4 | -1.2 | 0.0 | 2.4 | 0.0 | 0.0 |
| 254 | Sam Hous St | -5.3 | -2.0 | -0.7 | -1.4 | -1.3 | 0.0 | 0.0 | 0.0 | 0.0 |
| 255 | Mt St Marys | -5.5 | -4.2 | -1.9 | 0.8 | -0.2 | 0.0 | 0.0 | 0.0 | 0.0 |
| 256 | Albany | -5.5 | -4.0 | -0.3 | -0.7 | -0.8 | 0.0 | 0.4 | 0.0 | 0.0 |
| 257 | S Mississippi | -5.5 | -3.8 | -1.2 | 0.1 | -0.8 | 0.0 | 0.1 | 0.0 | 0.0 |
| 258 | No. Alabama | -5.5 | -4.4 | -2.9 | 1.0 | -0.3 | 0.0 | 1.1 | 0.0 | 0.0 |
| 259 | North Dakota | -5.6 | -2.9 | -1.1 | -0.9 | -0.6 | 0.0 | 0.0 | 0.0 | 0.0 |
| 260 | McNeese St | -5.7 | -3.2 | -3.0 | -0.9 | -1.5 | 0.0 | 2.9 | 0.0 | 0.0 |
| 261 | Jksnville St | -5.7 | -3.7 | 0.5 | -2.0 | -1.5 | 0.0 | 1.0 | 0.0 | 0.0 |
| 262 | Fairfield | -5.8 | -4.6 | -1.3 | -0.7 | -0.9 | 0.0 | 1.6 | 0.0 | 0.0 |
| 263 | LIU | -5.9 | -3.8 | -1.7 | -0.7 | -0.6 | 0.0 | 0.9 | 0.0 | 0.0 |
| 264 | Niagara | -5.9 | -4.9 | -1.7 | 0.8 | -0.1 | 0.0 | 0.0 | 0.0 | 0.0 |
| 265 | Rider | -6.0 | -1.6 | -0.3 | -3.1 | -1.6 | 0.0 | 0.6 | 0.0 | 0.0 |
| 266 | Manhattan | -6.1 | -3.9 | -2.0 | -0.6 | -0.9 | 0.0 | 1.4 | 0.0 | 0.0 |
| 267 | Lehigh | -6.3 | -4.9 | -0.1 | -0.8 | -0.6 | 0.0 | 0.0 | 0.0 | 0.0 |
| 268 | Detroit | -6.4 | -4.9 | -2.2 | 0.5 | -0.8 | 0.0 | 1.1 | 0.0 | 0.0 |
| 269 | NC Central | -6.4 | -4.3 | -1.7 | -0.5 | -0.5 | 0.0 | 0.6 | 0.0 | 0.0 |
| 270 | UMKC | -6.5 | -3.2 | -1.6 | -0.9 | -0.8 | 0.0 | 0.0 | 0.0 | 0.0 |
| 271 | WI-Milwkee | -6.5 | -3.8 | -1.5 | -0.5 | -0.7 | 0.0 | 0.1 | 0.0 | 0.0 |
| 272 | Radford | -6.5 | -1.6 | -0.6 | -3.0 | -1.7 | 0.0 | 0.4 | 0.0 | 0.0 |
| 273 | TN State | -6.6 | -3.4 | -1.1 | -1.4 | -0.7 | 0.0 | 0.0 | 0.0 | 0.0 |
| 274 | CS Fullerton | -6.7 | -3.4 | -0.7 | -2.4 | -1.3 | 0.0 | 1.1 | 0.0 | 0.0 |
| 275 | N Arizona | -6.7 | -2.5 | -2.9 | -0.6 | -0.8 | 0.0 | 0.2 | 0.0 | 0.0 |
| 276 | Cleveland St | -6.7 | -5.4 | -1.9 | 1.1 | -0.6 | 0.0 | 0.0 | 0.0 | 0.0 |
| 277 | Samford | -6.8 | -5.8 | -0.6 | -2.0 | -1.6 | 0.0 | 3.2 | 0.0 | 0.0 |
| 278 | LA Monroe | -6.8 | -3.5 | -0.6 | -2.7 | -1.3 | 0.0 | 1.3 | 0.0 | 0.0 |
| 279 | Central Ark | -6.8 | -4.9 | -2.0 | 0.6 | -0.5 | 0.0 | 0.0 | 0.0 | 0.0 |
| 280 | Seattle | -7.0 | -2.4 | -0.8 | -2.4 | -1.5 | 0.0 | 0.1 | 0.0 | 0.0 |
| 281 | Sacred Hrt | -7.0 | -2.1 | -2.1 | -2.0 | -1.5 | 0.0 | 0.8 | 0.0 | 0.0 |
| 282 | Loyola-MD | -7.0 | -4.3 | -1.9 | -0.4 | -0.4 | 0.0 | 0.0 | 0.0 | 0.0 |
| 283 | VA Military | -7.0 | -3.4 | -3.1 | -0.2 | -0.4 | 0.0 | 0.0 | 0.0 | 0.0 |
| 284 | Stetson | -7.1 | -4.5 | -3.2 | 1.0 | -0.3 | 0.0 | 0.0 | 0.0 | 0.0 |
| 285 | Cal Baptist | -7.1 | -1.6 | -2.5 | -2.9 | -1.7 | 0.0 | 1.5 | 0.0 | 0.0 |
| 286 | Evansville | -7.2 | -4.0 | -0.2 | -2.1 | -1.2 | 0.0 | 0.2 | 0.0 | 0.0 |
| 287 | Army | -7.3 | -4.2 | -1.4 | -1.3 | -0.4 | 0.0 | 0.0 | 0.0 | 0.0 |
| 288 | Morehead St | -7.3 | -4.9 | -1.5 | -0.6 | -1.1 | 0.0 | 0.8 | 0.0 | 0.0 |
| 289 | San Jose St | -7.4 | -4.8 | -2.5 | 0.6 | -0.7 | 0.0 | 0.0 | 0.0 | 0.0 |
| 290 | Bellarmine | -7.5 | -4.1 | -2.0 | -0.9 | -0.9 | 0.0 | 0.5 | 0.0 | 0.0 |
| 291 | Charl South | -7.5 | -5.8 | -1.6 | 0.5 | -0.7 | 0.0 | 0.0 | 0.0 | 0.0 |
| 292 | Jacksonville | -7.5 | -3.3 | -2.1 | -2.2 | -1.1 | 0.0 | 1.1 | 0.0 | 0.0 |
| 293 | Marist | -7.7 | -5.5 | -2.5 | 0.7 | -0.5 | 0.0 | 0.0 | 0.0 | 0.0 |
| 294 | Troy | -7.7 | -4.8 | -0.3 | -1.3 | -1.3 | 0.0 | 0.0 | 0.0 | 0.0 |
| 295 | Quinnipiac | -7.7 | -3.7 | -1.8 | -1.5 | -0.7 | 0.0 | 0.0 | 0.0 | 0.0 |
| 296 | TX A&M-CC | -7.7 | -5.0 | -1.6 | -0.2 | -0.9 | 0.0 | 0.1 | 0.0 | 0.0 |
| 297 | Merrimack | -7.8 | -3.0 | -3.3 | -0.9 | -0.6 | 0.0 | 0.0 | 0.0 | 0.0 |
| 298 | St Fran (NY) | -7.9 | -4.9 | -3.1 | 0.1 | -0.5 | 0.0 | 0.5 | 0.0 | 0.0 |
| 299 | Southern | -7.9 | -4.0 | -3.3 | -0.2 | -0.7 | 0.0 | 0.4 | 0.0 | 0.0 |
| 300 | New Orleans | -7.9 | -5.6 | -1.4 | -0.9 | -1.1 | 0.0 | 1.0 | 0.0 | 0.0 |
| 301 | Portland | -7.9 | -4.0 | -2.1 | -1.8 | -1.0 | 0.0 | 0.9 | 0.0 | 0.0 |
| 302 | Denver | -8.1 | -5.0 | -1.3 | -1.1 | -0.8 | 0.0 | 0.0 | 0.0 | 0.0 |
| 303 | IUPUI | -8.2 | -6.7 | -1.0 | 0.5 | -1.1 | 0.0 | 0.1 | 0.0 | 0.0 |
| 304 | SC Upstate | -8.2 | -6.0 | -3.0 | 1.1 | -0.3 | 0.0 | 0.0 | 0.0 | 0.0 |
| 305 | NC A&T | -8.3 | -4.2 | -3.6 | -0.6 | -0.6 | 0.0 | 0.6 | 0.0 | 0.0 |
| 306 | Idaho State | -8.3 | -4.4 | -2.5 | -0.8 | -1.1 | 0.0 | 0.4 | 0.0 | 0.0 |
| 307 | NW State | -8.4 | -4.4 | -3.9 | 0.5 | -0.6 | 0.0 | 0.0 | 0.0 | 0.0 |
| 308 | Bryant | -8.4 | -3.0 | -3.3 | -1.5 | -1.1 | 0.0 | 0.5 | 0.0 | 0.0 |
| 309 | Grambling St | -8.6 | -5.1 | -2.6 | -1.4 | -1.1 | 0.0 | 1.7 | 0.0 | 0.0 |
| 310 | Jackson St | -8.8 | -4.7 | -3.6 | -0.2 | -0.9 | 0.0 | 0.5 | 0.0 | 0.0 |
| 311 | Prairie View | -8.9 | -2.7 | -2.0 | -2.9 | -1.4 | 0.0 | 0.2 | 0.0 | 0.0 |
| 312 | SE Louisiana | -9.1 | -7.1 | -1.2 | -0.9 | -1.5 | 0.0 | 1.6 | 0.0 | 0.0 |
| 313 | Cal Poly | -9.2 | -4.8 | -2.8 | -0.9 | -0.8 | 0.0 | 0.1 | 0.0 | 0.0 |
| 314 | Wagner | -9.3 | -6.4 | -1.5 | -0.7 | -1.0 | 0.0 | 0.2 | 0.0 | 0.0 |
| 315 | SE Missouri | -9.4 | -6.4 | -1.8 | -2.3 | -1.7 | 0.0 | 0.8 | 2.0 | 0.0 |
| 316 | Cal St Nrdge | -9.7 | -3.4 | -2.2 | -1.9 | -2.8 | 0.0 | 0.6 | 0.0 | 0.0 |
| 317 | TN Tech | -9.9 | -6.1 | -2.0 | -0.8 | -1.1 | 0.0 | 0.0 | 0.0 | 0.0 |
| 318 | Citadel | -10.0 | -5.6 | -2.3 | -0.7 | -1.3 | 0.0 | 0.0 | 0.0 | 0.0 |
| 319 | High Point | -10.2 | -7.2 | -1.4 | -0.5 | -1.0 | 0.0 | 0.0 | 0.0 | 0.0 |
| 320 | Hampton | -10.3 | -5.3 | -1.6 | -2.4 | -0.9 | 0.0 | 0.0 | 0.0 | 0.0 |
| 321 | Morgan St | -10.3 | -5.9 | -3.5 | -0.4 | -0.8 | 0.0 | 0.3 | 0.0 | 0.0 |
| 322 | TN Martin | -10.4 | -6.2 | -1.9 | -2.0 | -1.3 | 0.0 | 1.0 | 0.0 | 0.0 |
| 323 | Idaho | -10.4 | -5.7 | -1.6 | -1.8 | -1.3 | 0.0 | 0.0 | 0.0 | 0.0 |
| 324 | Longwood | -10.5 | -5.4 | -3.7 | -1.1 | -1.1 | 0.0 | 0.9 | 0.0 | 0.0 |
| 325 | W Illinois | -10.8 | -6.6 | -2.4 | -3.4 | -1.1 | 0.0 | 0.7 | 2.0 | 0.0 |
| 326 | Florida A&M | -11.0 | -5.3 | -4.1 | -1.0 | -0.6 | 0.0 | 0.0 | 0.0 | 0.0 |
| 327 | Coppin State | -11.1 | -6.0 | -4.2 | -0.6 | -1.5 | 0.0 | 1.2 | 0.0 | 0.0 |
| 328 | Tarleton State | -11.9 | -7.1 | -3.0 | -1.5 | -1.5 | 0.0 | 1.2 | 0.0 | 0.0 |
| 329 | Alcorn State | -11.9 | -5.7 | -3.7 | -1.8 | -1.3 | 0.0 | 0.6 | 0.0 | 0.0 |
| 330 | SIU Edward | -12.2 | -6.2 | -3.0 | -1.6 | -1.4 | 0.0 | 0.1 | 0.0 | 0.0 |
| 331 | Binghamton | -12.5 | -6.5 | -2.7 | -1.7 | -1.9 | 0.0 | 0.3 | 0.0 | 0.0 |
| 332 | Maine | -12.7 | -5.3 | -3.5 | -2.5 | -1.3 | 0.0 | 0.0 | 0.0 | 0.0 |
| 332 | Holy Cross | -12.8 | -7.9 | -1.4 | -2.2 | -1.4 | 0.0 | 0.0 | 0.0 | 0.0 |
| 334 | Dixie State | -12.9 | -6.1 | -4.2 | -1.3 | -1.3 | 0.0 | 0.0 | 0.0 | 0.0 |
| 335 | Houston Bap | -12.9 | -7.3 | -2.3 | -2.6 | -1.5 | 0.0 | 0.8 | 0.0 | 0.0 |
| 336 | Presbyterian | -13.1 | -6.5 | -3.0 | -2.0 | -1.6 | 0.0 | 0.0 | 0.0 | 0.0 |
| 337 | Central Conn | -13.5 | -8.5 | -3.2 | -0.2 | -1.6 | 0.0 | 0.0 | 0.0 | 0.0 |
| 338 | Alab A&M | -13.7 | -7.8 | -4.2 | -0.2 | -1.5 | 0.0 | 0.0 | 0.0 | 0.0 |
| 339 | Incar Word | -13.8 | -7.7 | -3.8 | -0.8 | -1.6 | 0.0 | 0.0 | 0.0 | 0.0 |
| 340 | Howard | -14.7 | -8.8 | -3.4 | -2.1 | -2.1 | 0.9 | 0.8 | 0.0 | 0.0 |
| 341 | Ark Pine Bl | -15.2 | -8.9 | -3.8 | -0.6 | -1.9 | 0.0 | 0.0 | 0.0 | 0.0 |
| 342 | S Car State | -15.2 | -7.0 | -4.1 | -2.2 | -1.8 | 0.0 | 0.0 | 0.0 | 0.0 |
| 343 | Alabama St | -15.3 | -6.7 | -4.0 | -2.9 | -1.7 | 0.0 | 0.1 | 0.0 | 0.0 |
| 344 | Delaware St | -15.9 | -8.6 | -4.2 | -1.7 | -1.8 | 0.0 | 0.5 | 0.0 | 0.0 |
| 345 | Kennesaw St | -16.7 | -9.6 | -2.6 | -2.2 | -2.2 | 0.0 | 0.0 | 0.0 | 0.0 |
| 346 | Miss Val St | -19.8 | -11.9 | -4.2 | -1.6 | -2.6 | 0.0 | 0.5 | 0.0 | 0.0 |
| 347 | Chicago St | -20.1 | -12.1 | -4.2 | -1.2 | -2.5 | 0.0 | 0.0 | 0.0 | 0.0 |
What Do We Use These For?
These preseason ratings drive our preseason projections, and they serve as the Bayesian priors for our predictive ratings as the season progresses. (Translation: our preseason ratings still impact our team ratings even months into the season, because that has shown to be more predictive than not.)
Using these ratings, we’ve run full season projections, which are live on the site now. Key pages include:
College Basketball Projected Conference Standings. Projected conference records and full regular season records, plus win odds for both the conference regular season title and the postseason tournament.Bracketology Projections. Odds to make the NCAA tournament, plus projected seeding, and lots more details. (One of our faves is the Bracketology By Conference page.)NCAA Tournament Bracket Predictions. Round by round advancement odds, including probability of a team making the Sweet 16, making the Final Four, and winning the championship.
This is all data-driven, and automated, so it will update every morning throughout the season.
Ratings Accuracy
It’s worth noting that Ken Pomeroy, Dan Hanner and Bart Torvik have compared our preseason ratings and/or projections with other stat-based prognosticators in past years. Our finish has been consistently good, though it was consistently a bit behind Dan Hanner’s bottom-up, player-based projections while Dan doing them (he unfortunately stopped after the 2017-18 season).
2019-20: (unfortunately, we couldn’t find a comparison for the most recent season)2018-19: 4th of 18 (behind Torvik, Gasaway, Pomeroy*)2017-18: 2nd of 7 (behind Hanner)2016-17: 4th of 7 (behind Torvik, Hanner, Gasaway)2015-16: 2nd of 7 (behind Hanner)2014-15: 2nd of 4 (behind Hanner)2013-14: 2nd of 4 (behind Hanner)2012-13: 1st of 3
*It’s worth noting that this analysis used the final Pomeroy ratings as the “true” result, so Pomeroy may have a bit of an advantage here.
(Links go to the comparison blog posts or Google Doc data files from Ken/Dan/Bart.)
Taking several years of data into account, and placing some emphasis on long term consistency, we feel we’re objectively right up at the top of the standings for “most accurate preseason computer rankings” based on the tracking above — not as good as Dan Hanner’s now-defunct player lineup based projections were, but ahead of systems like KenPom and ESPN BPI.
In terms of human ratings, John Gasaway leads the pack, and has performed only slightly worse than our computer ratings longer term.
We say this not to brag, but to try to preemptively defend ourselves against the inevitable “Team X is WAY too high/low in your rankings! You guys have no idea what you’re doing!” comments. While our rankings are by no means perfect, the projections they drive have more than held their own in comparisons with other “famous” projection systems. We expect them to do so again this season.
Some Final Advice On Interpreting Preseason College Basketball Rankings
Some people get quite worked up about preseason college basketball rankings — especially when our approach thinks their favorite team is going to be worse than the prevailing consensus.
Differences are to be expected, though. No one else ranks teams exactly like we do, and our approach often discounts things that media analysts and other basketball “experts” believe to be important, because we haven’t found any hard data to back up their supposed value.
Just remember, we’re going to get plenty of individual teams wrong this year, and some teams very wrong, for a variety of reasons. But that’s inevitable when the challenge is to project over 300 different teams. If we’re down on your team, just hope that we’re wrong! No system is perfect, and just like the rest of them, ours has both strengths and weaknesses.
We also have a very specific goals for our preseason college basketball team ratings, which include predicting both the margins of victory of future college basketball games and the end-of-season ratings of all 347 teams, in a way that minimizes error over the entire universe of games and teams. That goal doesn’t line up with the motivations of many other rankings makers.
Look at Ratings, Not Just Rankings
Finally, please remember to look at our team ratings and not just rankings, because ratings tell a much more precise story.
For example, Florida is our No. 22 team in our preseason rankings this year. However, their rating is only one point lower than No. 15 Kentucky’s rating, meaning that there’s a cluster of 8 teams all rated within one point of one another, a very slim difference.
So don’t overreact to a team’s ranking number. Look at the rating as well, and you’ll be able to tell which generally expected performance tier a team is in.
Before You Go …
As a final reminder, be sure to check out the season projections we create using these 2020 college basketball preseason rankings. There’s a ton to see:
College Basketball Projected Conference Standings. Projected conference records and full regular season records, plus win odds for both the conference regular season title and the postseason tournament.Bracketology Projections. Odds to make the NCAA tournament, plus projected seeding, and lots more details.NCAA Tournament Bracket Predictions. Round by round advancement odds, including probability of a team making the Sweet 16, making the Final Four, and winning the championship.
If you liked this post, please share it. Thank you! Twitter Facebook
NFL Football Pool Picks NFL Survivor Pool Picks NCAA Bracket Picks College Bowl Pool Picks College Football Pool Picks NFL Picks NBA Picks MLB Picks College Football Picks College Basketball Picks NFL Predictions NBA Predictions MLB Predictions College Football Predictions College Basketball Predictions NFL Spread Picks NBA Spread Picks MLB Spread Picks College Football Spread Picks College Basketball Spread Picks NFL Rankings NBA Rankings MLB Rankings College Football Rankings College Basketball Rankings NFL Stats NBA Stats MLB Stats College Football Stats College Basketball Stats NFL Odds NBA Odds MLB Odds College Football Odds College Basketball Odds A product ofTeamRankings BlogAboutTeamJobsContact
© 2005-2024 Team Rankings, LLC. All Rights Reserved. Statistical data provided by Gracenote.
TeamRankings.com is not affiliated with the National Collegiate Athletic Association (NCAA®) or March Madness Athletic Association, neither of which has supplied, reviewed, approved or endorsed the material on this site. TeamRankings.com is solely responsible for this site but makes no guarantee about the accuracy or completeness of the information herein.
Terms of ServicePrivacy Policy